
In these challenging times marked with inflation, climate change, pandemics, and geo-political tensions, one should be concerned with the situation of the poorest economies, in Africa notably.
And rightly so, food insecurity, human capital losses, adaptation to climate change, conflicts, and growing macroeconomic imbalances capture most of the attention of African citizens, governments, and development institutions, with maybe an old tune of Afro-pessimism: poor African countries will never get out of their poverty traps, as they are confronted with too many problems.
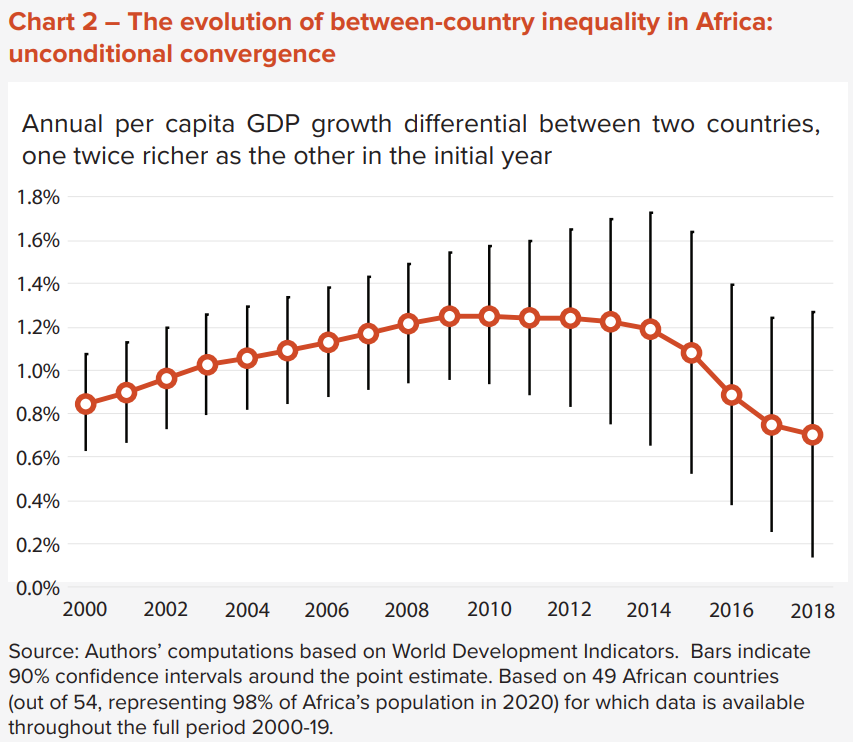
Yet, there is a bright spot: a recent analysis conducted on Africa’s income inequality suggests that poorer African economies have consistently grown faster in per capita terms since 2000 than richer ones, a pattern never observed before since the independence in the 1960s. As a result, income inequality between countries has significantly decreased, a trend confirmed by the strong decline in the population-weighted average Gini coefficient of inequality between African countries, from 0.44 in 2000 to 0.39 in 2020.
The observation of inequality within each country – suggesting a small decline over the same period, is less uniform and less clear, and its measurement is more complicated.
But the decline in inequality between countries is so significant that it likely contributed to a net reduction of inequality between African citizens once countries’ population sizes are taken into consideration.
Many reasons can potentially explain this positive outcome, starting from the adoption of better economic and social policies in poorer countries, a growing priority given by international financial institutions to the poorest countries, and economic fundamentals that entail higher returns to investment in less capitalized economies.
But it is also very likely that regional (and global) integration efforts undertaken in Africa since 2000 significantly contributed to this outcome, allowing the poorest economies to benefit from access to larger markets and attract more human, financial, and technological resources to support their economic development. Since 2000, the intra African trade doubled in proportion of the total trade.
Goods and services exchanged within Africa are of higher added value than with the rest of the world.
This is due to the development of connective infrastructure including transport, digital and energy networks, economic corridors, regional capital markets, and facilitation efforts to streamline cross-border trade.
While it is difficult to attribute from a methodological standpoint, progress in regional integration such as in the European Union produces the income convergence observed between African countries since 2000.
This achievement should accelerate regional integration efforts, even more so as opportunities to further deepen economic ties with other continents seem to shrink due to ongoing geopolitical tensions and calls to re-shore economic activities.
The African Continental Free Trade Area (AfCFTA) provides this opportunity.
Efforts should be sustained to implement already negotiated tariff schedules, conclude agreements in trade for digital services given their potential for the continent in the context of rapid urbanization, and accelerate trade facilitation.
It will encourage trade-related investment and the development of regional value chains in many sectors, from agribusiness and light manufacturing to pharmaceuticals and cars, and the creation of millions of jobs (up to 18 million by 2035, according to a recent World Bank study on the expected impact of the AfCFTA).
This article first appeared here.
****
Measuring Services Trade Barriers in South Africa 2022
Obstacles to global services trade, remain pervasive as national trade and regulatory policies in individual services sectors are often made with limited regard for economy-wide impacts.
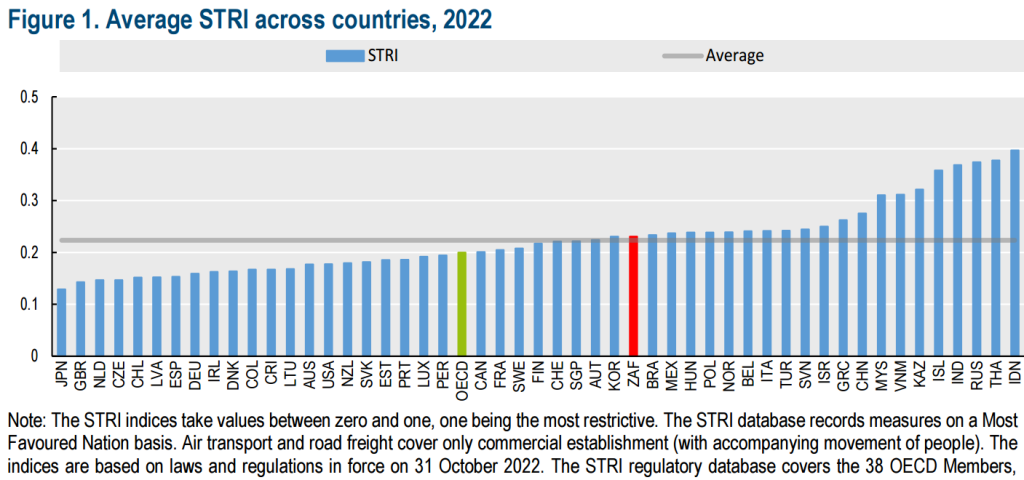
Launched in 2014, and updated annually, the OECD Services Trade Restrictiveness Index (STRI) is a unique, evidence-based tool that provides information on regulations affecting trade in 22 services sectors across all OECD member countries including South Africa.
These countries and sectors represent over 80% of global trade in services.
The the OECD’s Latest Services Trade Restrictiveness Index were released yesterday. Download it here.
Watch this video to gain an improved understanding of why services trade matters.
The latest report is valuable evidence-based research and can support:
- Policymakers to scope out reform options, benchmark them relative to global best practice, and assess their likely effects;
- Trade negotiators to clarify restrictions that most impede trade, and
- Businesses to shed light on the requirements that traders must comply with when entering foreign markets.
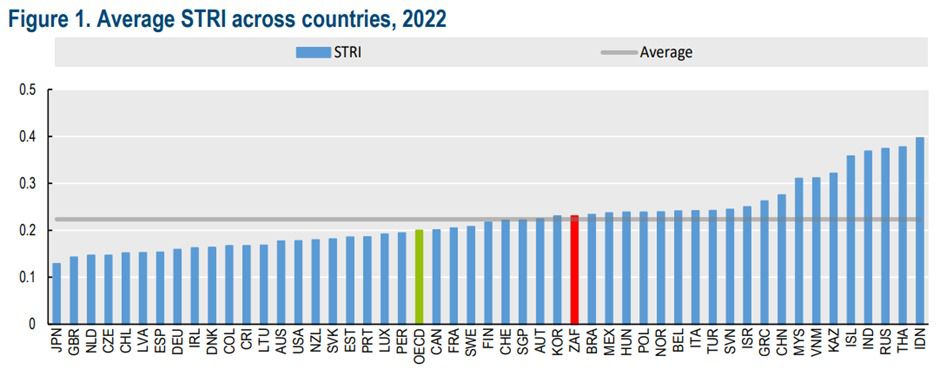
Key findings for South Africa’s latest ranking are:
- The 2022 Index value of South Africa is above the OECD average and relatively high compared to other countries in the same analysis.
- Recently South Africa demonstrated significant progress in liberalising its insurance services.
- However, since 2014 regulations have tightened in all other services sectors covered by the service trade index. This makes it harder to stimulate trade in South African services.
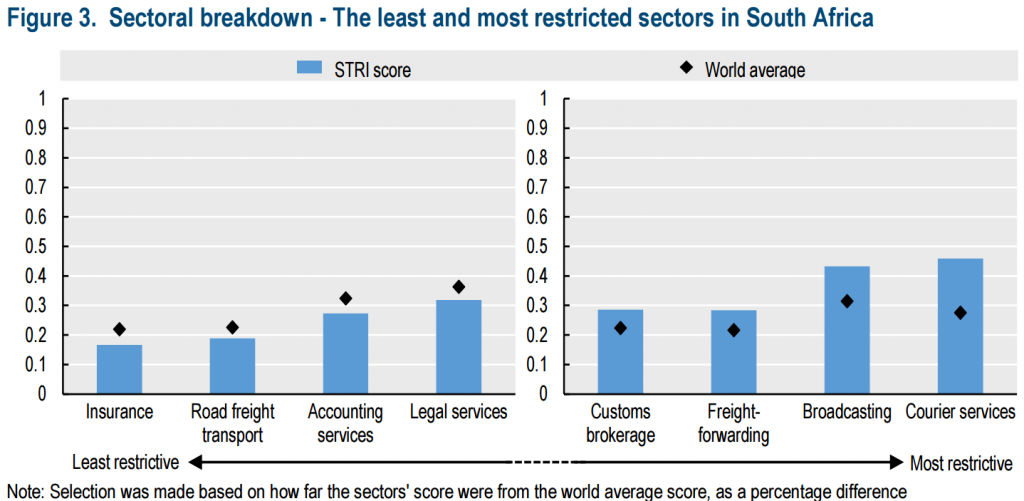
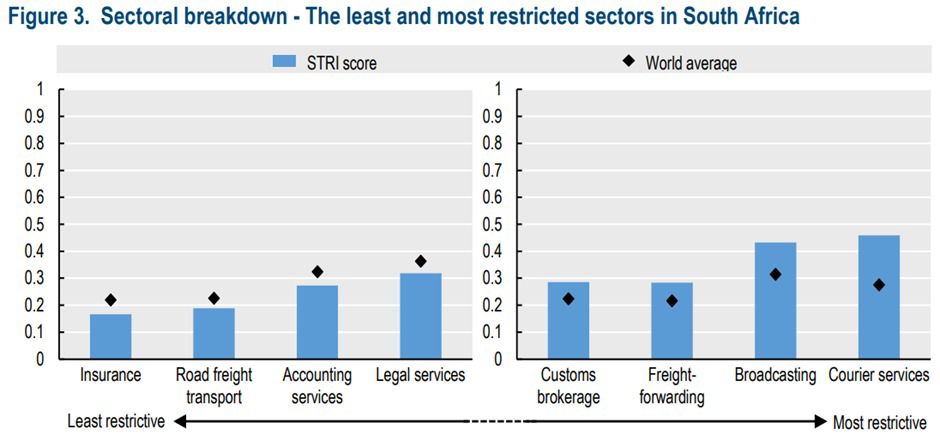
- Insurance, road freight transport, accounting services, and legal services are the sectors in South Africa with the lowest trade restrictions.
- Logistics customs brokerage, logistics freight-forwarding, broadcasting and courier services are the sectors in South Africa with highest trade restrictions.
Insurance services are the least restricted service sector in South Africa:
- Relatively low restrictions on foreign entry and fewer barriers to competition compared to other countries.
- Increased powers and stability of the supervisory authority and the removal of residency requirements on managers in the sector helped South Africa’s score.
Courier services are the most restricted services sector in South Africa:
- The restrictions on foreign entry are significant compared to best performing countries.
- Screening mechanisms to foreign direct investment, and the requirement of a commercial presence to provide cross-border service do not help.
How do we improve the services trade environment in South Africa?
- Understand the vital role and importance of open and well-regulated services markets and that they are essential to facilitate economic recovery, strengthen resilience to future shocks, and promote a more sustainable trading system.
- To ensure that the benefits of open markets and a rules-based international trading system are preserved, South African policy makers should focus on minimising barriers that increase trade costs for services providers, and that weaken the gains from digital transformation and undermine competitiveness.
****
Global trade May break the record in 2022
Global trade is set to reach a record level of about US$32 trillion for 2022, according to a United Nations Conference on Trade and Development (UNCTAD) report published in late 2022.
But deteriorating economic conditions and rising uncertainties have resulted in a trade slowdown during the second half of the year, and it is expected to worsen in 2023.
It has been a year of bad news for global trade with consumer price inflation touching a 40-year high, a crippling energy crisis, and a war wreaking havoc on supply chains worldwide.
Still, according to UNCTAD, trade soared in the first half of 2022 largely driven by sharp rises in energy prices.
UNCTAD expects it will hit a record high of US$32 trillion in 2022, but inflation, geopolitical unrest, and macroeconomic deterioration reversed some of the gains made in the first half.
This briefing explores four key takeaways from the report that reflect on the state of global trade in the past year and highlight trends to watch out for in the coming year.
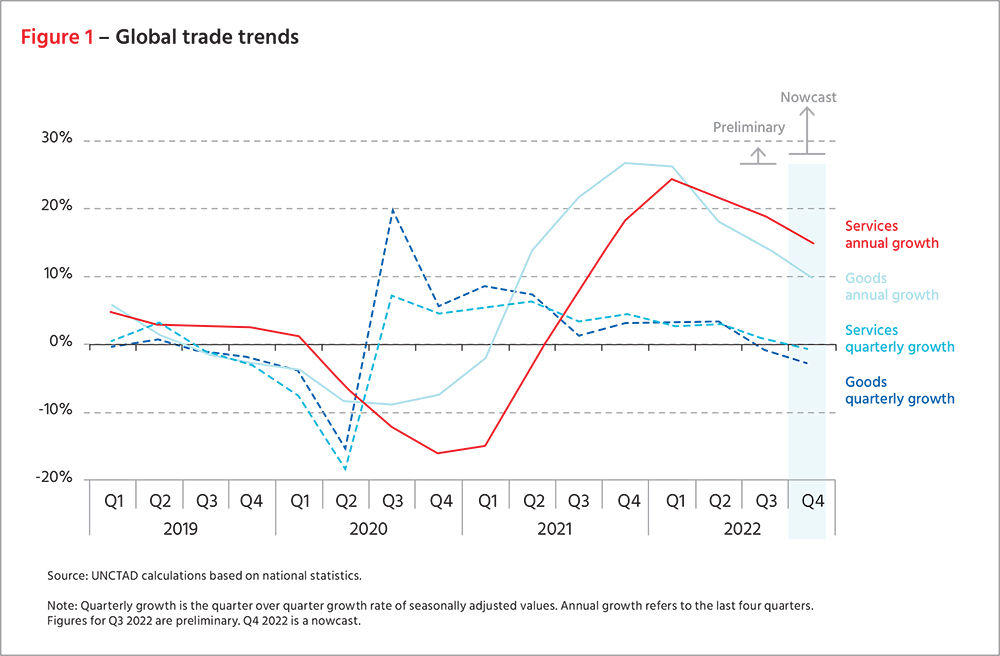
1. Global trade had a record year
Trade in goods reached a total US$ 25 trillion, up by 10 percent from 2021, and trade in services totaled US$ 7 trillion, a 15 percent increase from 2021.
Strong growth in the first half of 2022 led to the increase, but this was largely driven by an increase in prices for energy products; trade volumes rose by a more modest three percent.
High demand for energy as the world opened up after pandemic lockdowns and tight oil supply due to the Ukraine war pushed energy prices up significantly.
However, the value of global trade for goods decreased in the second half of 2022, amid deteriorating economic conditions and rising uncertainties.
Trade in services has been more resilient.
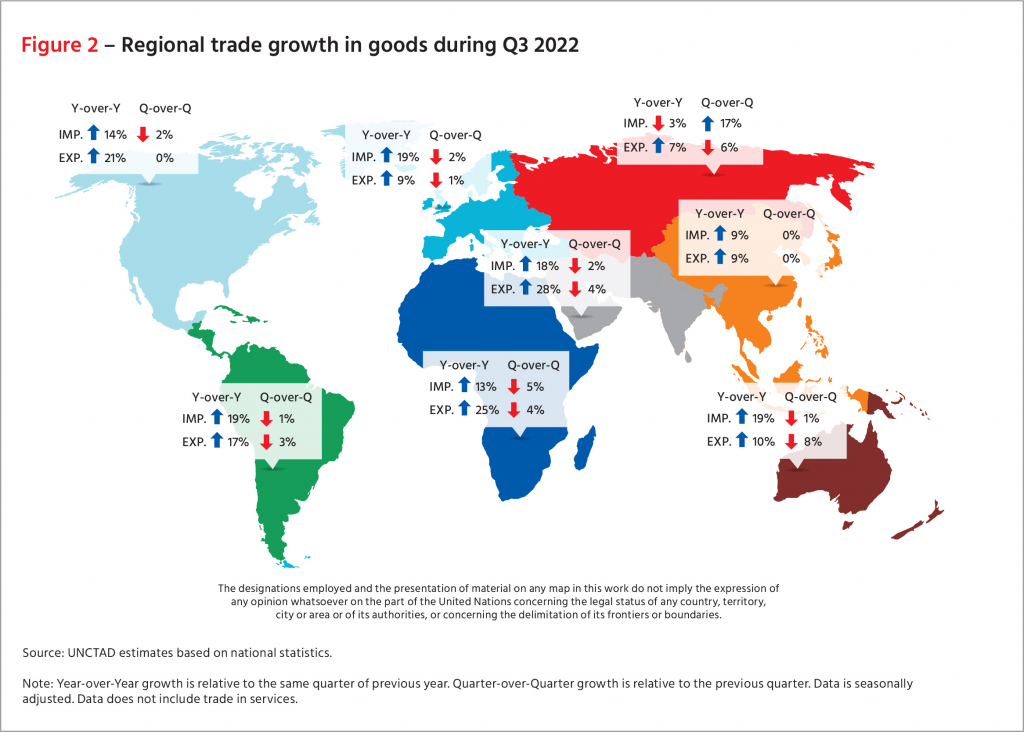
2. Regional trade
Analysis of the trade activity of individual countries and regions found that all major economies except Russia performed better compared to a year ago.
Russia has faced some of the most severe economic sanctions and trade restrictions in history, imposed by the US, the European Union, and other countries following its invasion of Ukraine, which significantly hurt its economy.
Trade in goods between developing countries (South-South trade) was about 13 percent higher compared with 2021.
While year-over-year growth rates remained generally strong across all geographic regions, trade value declined in the third quarter from the preceding three months in all but two geographic regions: East Asia, where it flatlined, and, surprisingly, Russia, where other reports suggest a recovering ruble and a tentative return of businesses helped boost imports in that period.
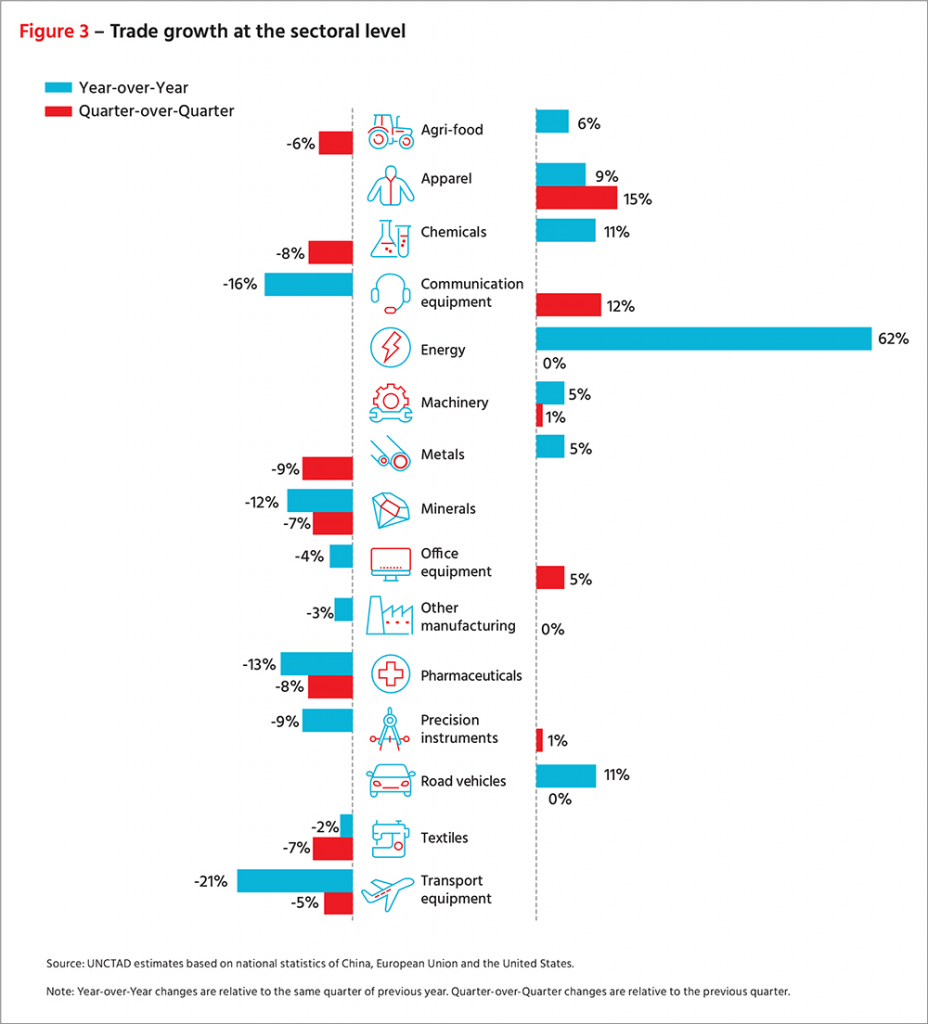
3. Sectoral trade
Increases in the value of the trade of energy products, driven by rising prices, led to substantial trade growth during 2022.
Trade in some sectors such as apparel, chemicals, and automotives increased from 2021 levels while the value of trade was lower for several sectors including pharmaceuticals, minerals, communication equipment, and transport equipment.
In comparison with the second quarter of 2022, the value of trade in the third quarter of 2022 was lower for most sectors though apparel, communication equipment, and office equipment remained largely resilient.
The overall trend underscores a slowdown in global trade in the second half of the year.
4. Negative factors outweigh positive trends in 2023
While the outlook for global trade remains uncertain, negative factors for now outweigh positive trends in the coming year.
Among negative trends for the coming year, UNCTAD lists low economic growth, high prices of traded goods, and debt unsustainability.
Economic growth forecasts for 2023 will see a downward revision due to rising interest rates, sustained global inflation, and negative economic spillovers from the war in Ukraine.
Consistently high energy and consumer goods prices will stifle global demand for imports and lead to a decline in the volume of international trade.
The increase in interest rates is expected to intensify pressure on highly indebted governments, increasing vulnerabilities and negatively affecting investments and international trade flows.
Among positive trends, are improvements in the logistics of global trade, as ports and shipping companies adjust to the challenges posed by Covid-19.
Recently signed trade agreements coming to fruition may also help boost trade.
This article first appeared here.
****
All Eyes on Geopolitical Uncertainty
Russia’s invasion of Ukraine up-ended supply chains, triggered food shortages, and turned trade itself into a weapon of war. It underscores how geopolitical uncertainty increasingly dictates the outcomes of sustainable trade.
In peacetime, trade is an expression of the trust across national borders, formed through collaboration and mutually beneficial agreements that bring certainty and stability to international relations.
The rules-based multilateral trading system serves to minimize risk and volatility through shared principles, frameworks for dispute settlement, and mechanisms to ensure healthy competition. However, turbulence in geopolitics rattles this foundation, disrupts trade, and in some instances, cascades into protectionism and civil unrest.
Geopolitics is fundamental to macroeconomics, and trade has historically been weaponised amidst high geopolitical tension.
In the 1930s, Italy faced an extensive number of sanctions including a ban of all imports from Italy for its invasion of Ethiopia.
Today, a similar response is seen against Russia’s invasion of Ukraine.
The Russia-Ukraine war led to trade sanctions, a food crisis, and energy shortages around the world as borders shut and the flow of goods halted.
Similarly, the US-China trade war resulted in harmful tariffs and global instability.
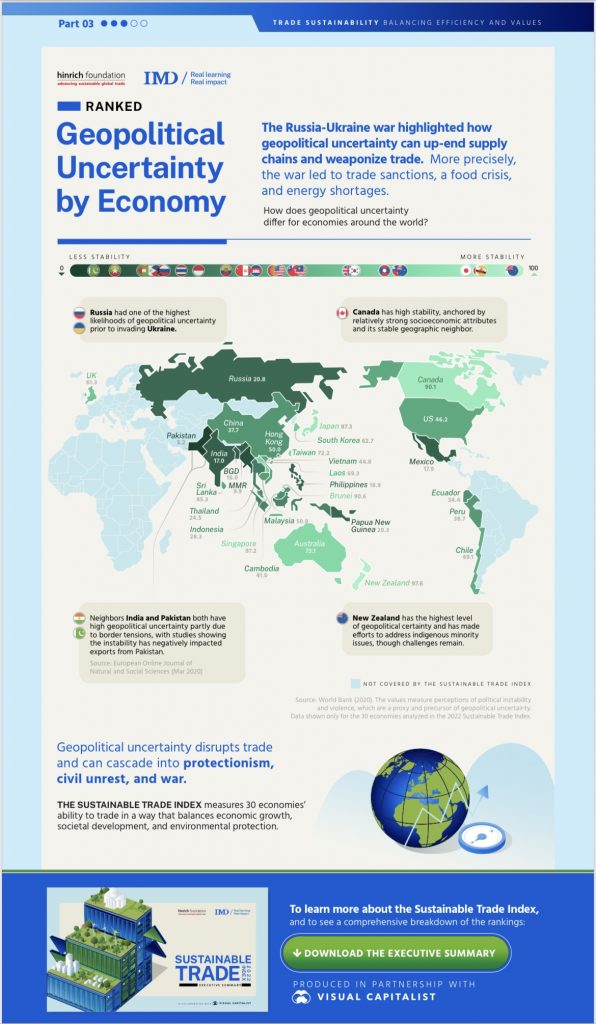
Geography matters.
Take Pakistan and India. Both ranked lowly in political stability at 5.2 and 17 on a scale of 100 respectively in the Hinrich-IMD Sustainable Trade Index 2022.
The two countries have high geopolitical uncertainty in part due to border tensions, with studies showing the instability has negatively impacted exports from Pakistan.
Contrastingly, Canada ranked highly at 90.1, anchored by strong socioeconomic attributes and a stable geographic neighbourhood.
Countries that score well on this count, such as New Zealand, Singapore, and Brunei, share common characteristics: political stability, low rates of civil violence, and absence of terrorism.
The above infographic illustrates how 30 key trading economies around the world fare in fostering political stability and eliminating violence, based on data provided by the Hinrich Foundation’s Sustainable Trade Index.
Policymakers and businesses around the world should brace for greater global economic uncertainty as geopolitical uncertainty looms.
This article first appeared here.
****
The new Cold War?
And why the US and China are fighting over silicon computer chips.
The US placed a large-scale ban on the sale of advanced semiconductor chips to China.
And implemented a series of other rules that prevents China from making these chips on their own.
These chips are used in everyday technology, like our mobile phones and computers.
They’re also crucial to military and intelligence systems, which is one of the main reasons they’re at the centre of the US-China feud.
Microchips were first invented in the US in the 1950s. Since then, the supply chain for these chips has grown and spread to include countries in Europe and Asia. Some countries have caught up to the US’s edge in making these advanced chips, China still falls far behind despite multiple attempts to gain an advantage.
Source: VOX
*****
Globalization’s Turn to Slowbalization after Global Financial Crisis
Trade openness increased after the Second World War but has slowed following the global financial crisis. The free flow of ideas, people, goods, services, and capital across national borders leads to greater economic integration. But globalization, the trend toward these things moving ever more freely between nations, has seen ebbs and flows over the decades.
Those trends are coming into sharper focus this year as policymakers work to understand and address the prospect of geoeconomic fragmentation, which threatens to undo the integration that has improved the lives and livelihoods of billions of people.
Looking back over a century and a half of data, the main phases of globalization are clearly visible using the trade openness metric – the sum of exports and imports of all economies relative to global gross domestic product.
As the chart below illustrates, globalization plateaued in the decade and a half since the global financial crisis. This latest era is often referred to as slowbalization.
Each of the chart’s five main periods was characterized by different configurations of economic and financial powers, and different rules and mechanisms for economic and financial ties between countries, as the IMF recently highlighted in a staff note that discussed the impact of trade fragmentation as well as technological decoupling.
The Industrialization era
A period when global trade – dominated by Argentina, Australia, Canada, Europe, and the United States – was facilitated by the gold standard. It was largely driven by transportation advances that lowered trade costs and boosted trade volumes.
The Interwar era
Saw a dramatic reversal of globalization due to international conflicts and the rise of protectionism. Despite the League of Nations push for multilateral cooperation, trade became regionalized amid trade barriers and the breakdown of the gold standard into currency blocs.
The Bretton Woods era
Saw the United States emerge as the dominant economic power with the dollar, then pegged to gold, underpinning a system with other exchange rates pegged to the greenback. The post-war recovery and trade liberalization spurred rapid expansion in Europe, Japan, and developing economies, and many countries relaxed capital controls. But expansionary US fiscal and monetary policy driven by social and military spending ultimately made the system unsustainable. The US ended dollar-gold convertibility in the early 1970s, and many countries switched to floating exchange rates.
The Liberalization era
Saw gradual removal of trade barriers in China and other large emerging market economies and unprecedented international economic cooperation, including the integration of the former Soviet bloc. Liberalization accounted for most of the increase in trade, and the WTO, established in 1995, became a new multilateral overseer of trade agreements, negotiations and dispute settlement. Cross-border capital flows surged, increasing the complexity and interconnectedness of the global financial system.
Current Slowbalization era
Followed the global financial crisis has been characterized by a prolonged slowdown in the pace of trade reform and weakening political support for open trade amid rising geopolitical tensions.
****
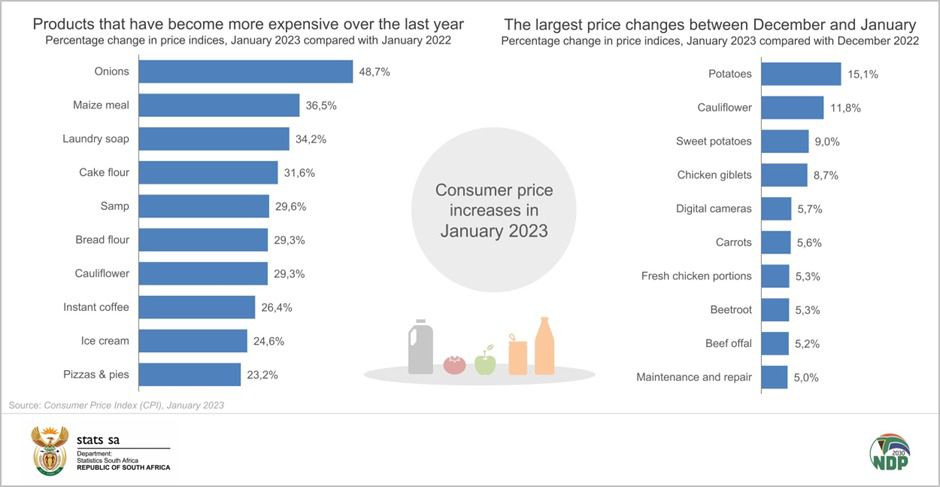
South African Consumer Inflation Cools to 6,9% in Jan 2023.
A notable fall in the price of fuel was the biggest factor behind the dip in the headline rate.
Food inflation, however, continues to accelerate.